> ## Documentation Index
> Fetch the complete documentation index at: https://cubed3-claude-gallant-ramanujan-86st4p.mintlify.site/llms.txt
> Use this file to discover all available pages before exploring further.
# Querying data
> In the Semantic Query tab, you can query the semantic layer. On the left, there is a selector for the semantic view that you want to query.
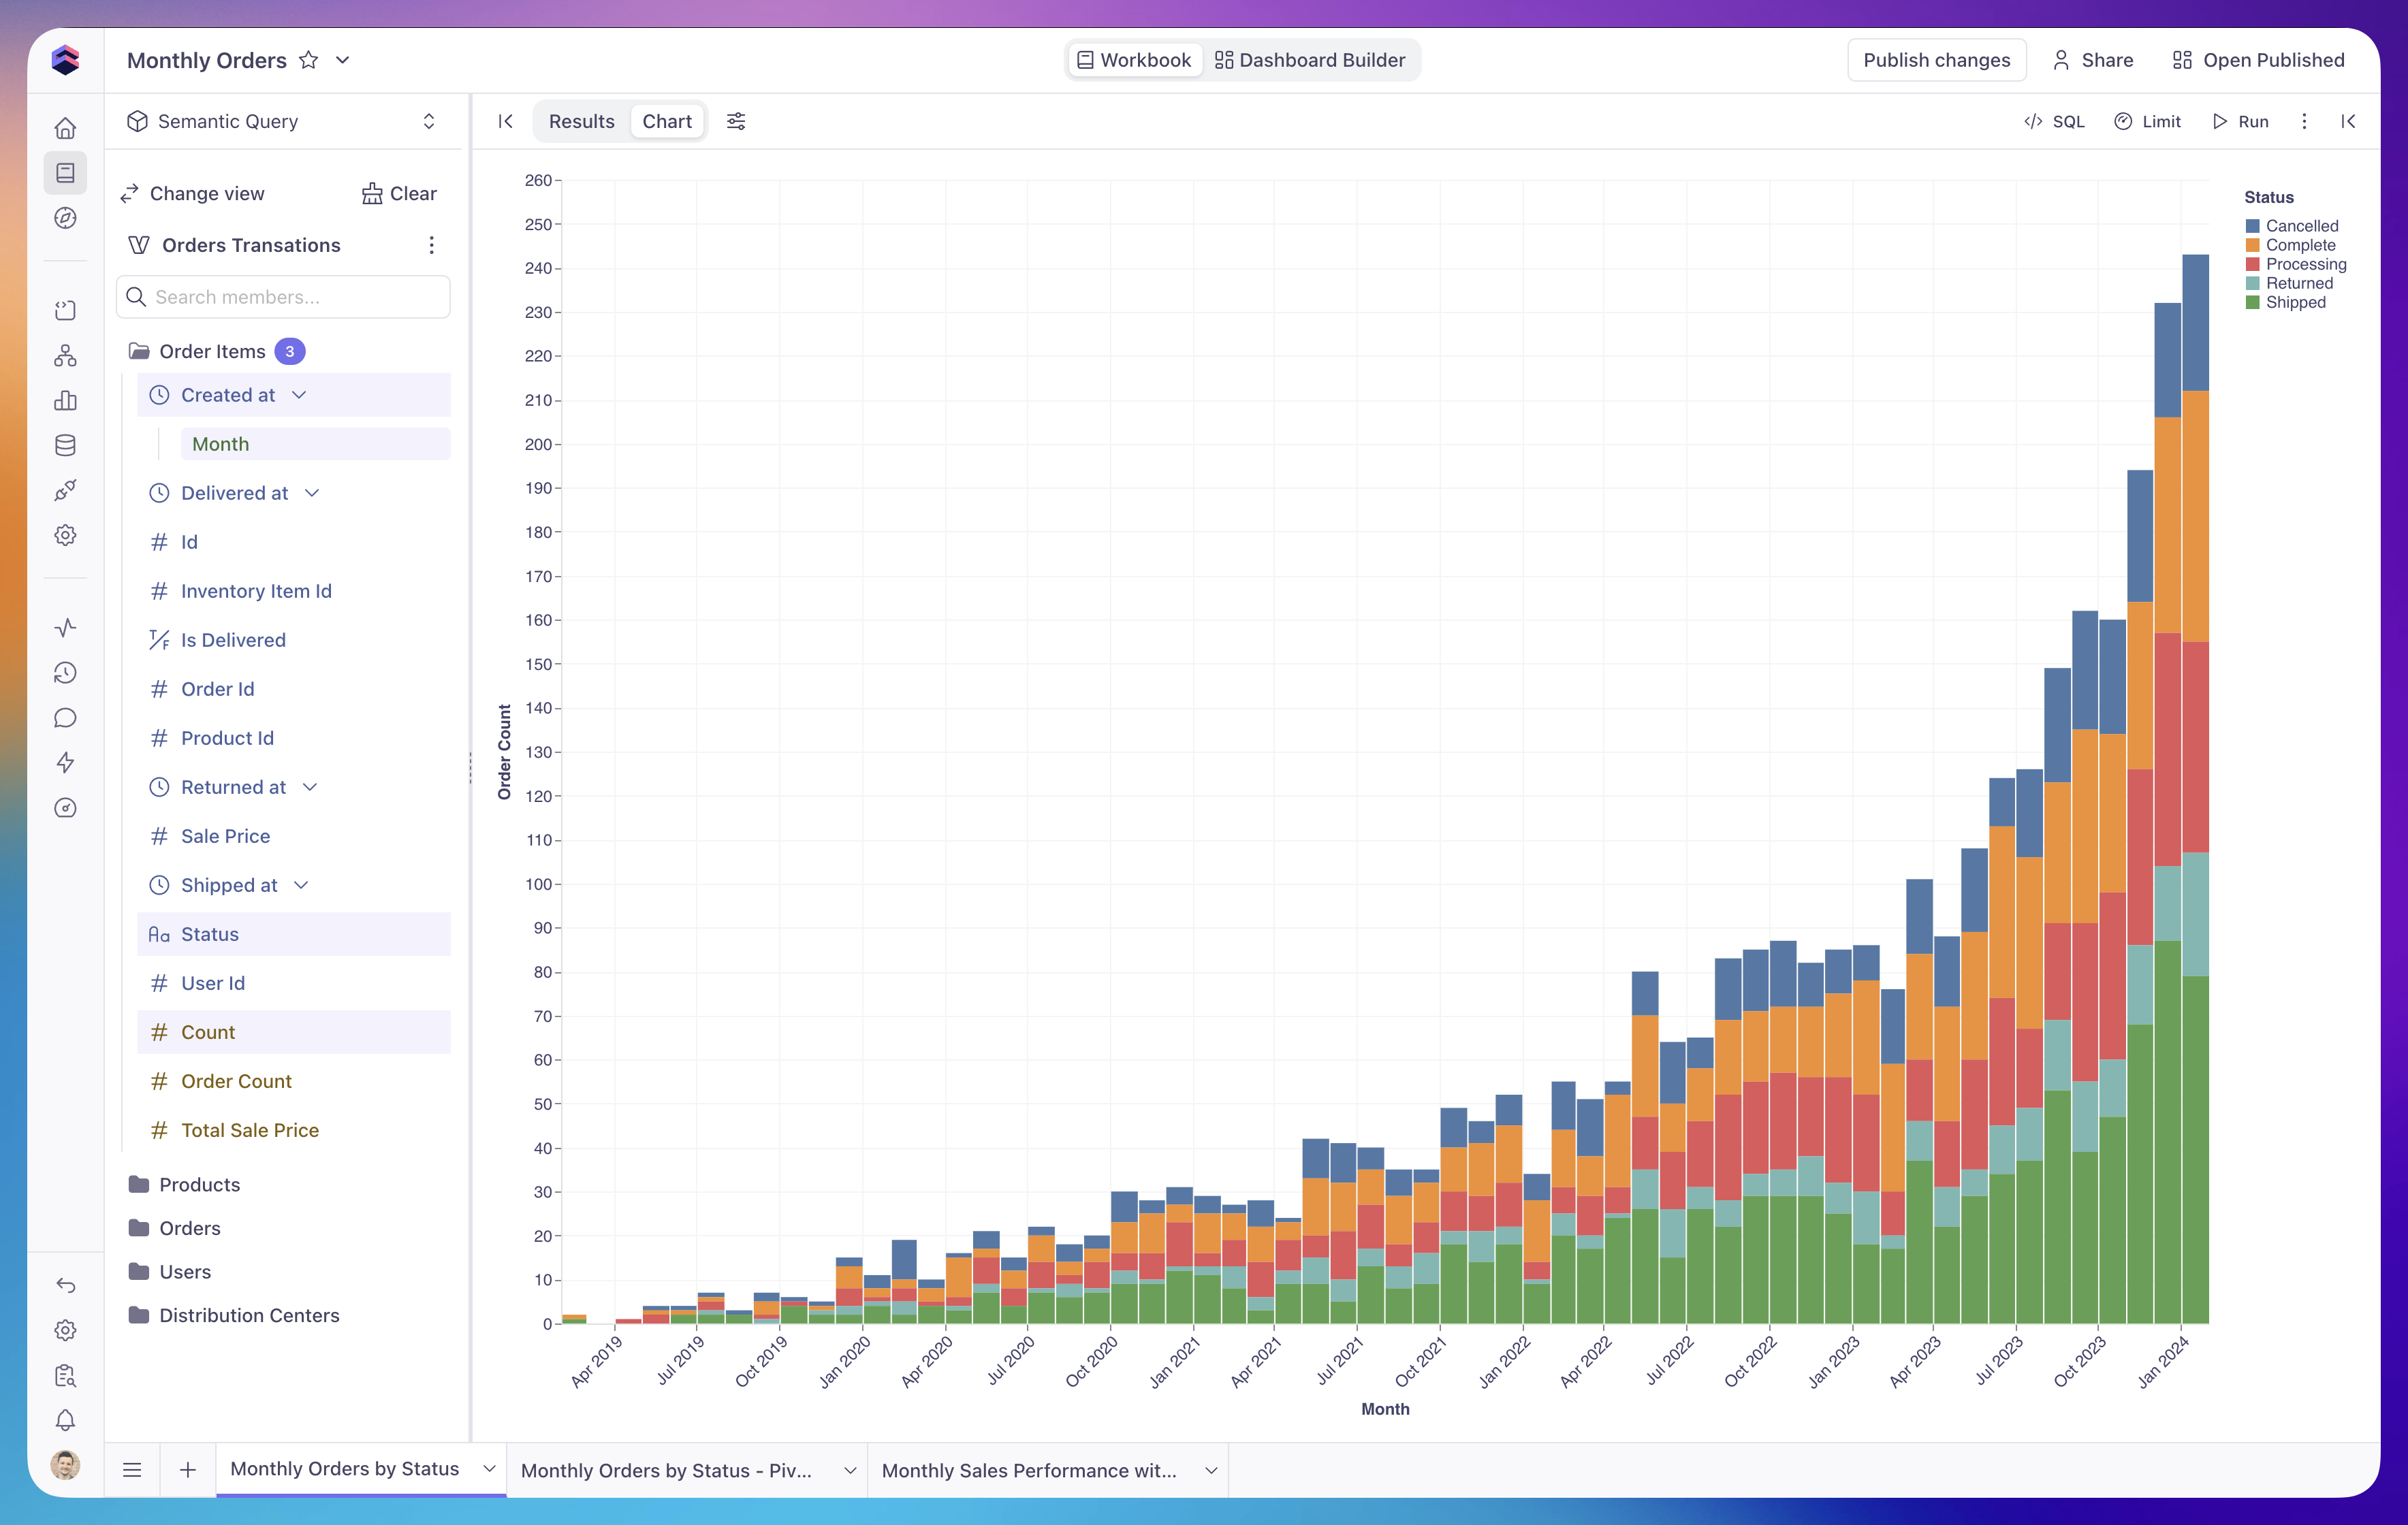 On the left side, you can select a semantic view you would like to query. Inside the semantic view, you can see the measures and dimensions grouped either by cubes or folders. You can search within your semantic view to find the relevant member.
## Running queries
As you build a query — adding members, changing filters, adjusting sorting —
the workbook runs it automatically and refreshes the results. You can turn
this off with the auto-run toggle in the query controls: with auto-run
disabled, the results are marked as outdated while you edit the query, and
the query only runs when you click **Run query**. The toggle applies to the
current tab only.
A data model author can change the default for a semantic view with the
[`meta.auto_run`][ref-auto-run] parameter — selecting a view with
`auto_run: false` starts the tab with auto-run disabled. This is useful for
views that are expensive to query. You can still toggle auto-run back on at
any time.
An admin can also turn auto-run off by default for every tab in the
deployment, from **Model Configuration**. Per-view and per-tab settings still
take precedence over this deployment-wide default. See
[Auto-run][ref-configuration-auto-run] in the Model Configuration reference.
When a cell's value is too long for its column, it is truncated with an
ellipsis. Hover over a truncated cell to see its full value in a tooltip.
## Filtering
Dimensions and measures can be added as filters to focus on specific rows of data.
### Default filters
A data model author can define default workbook filters on a semantic view with
the [`meta.default_ui_filters`][ref-default-ui-filters] parameter:
```yaml theme={null}
views:
- name: orders_view
cubes:
- join_path: orders
includes: "*"
meta:
default_ui_filters:
- member: created_at
operator: between
values: ["7 days ago", "today"]
- member: status
operator: is
values: ["completed"]
```
When you select such a view in a new tab, those filters are added to the query
automatically. They behave exactly like filters you add yourself: you can
change their values, switch operators, or remove them.
Date range filters can use relative bounds like `7 days ago` or `this month`.
A relative range resolves each time the query runs, so the window rolls
forward day over day, and the filter's date editor opens on the **Relative**
tab showing its bounds. See
[`default_ui_filters`][ref-default-ui-filters] for the full list of accepted
operators and values.
Resetting the tab or going back to the view list clears default filters
along with the rest of the query; they are seeded again the next time you
select a view.
## Pivoting
You can add dimensions to the pivot by right-clicking on the left pane or in the results header.
Note that chart tables are different from results tables. You can configure pivots in chart tables separately.
## Totals
The totals menu (the **Σ** button) in the results toolbar adds summary rows
and columns to the results table: **Column Totals** (a pinned row at the
bottom with a total for each measure column), **Row Totals** (a total for
each row across the pivoted columns), and **Subtotals** (see below). All
three can be enabled at once; each setting is saved with the report and
carries over when you switch the chart type to [Table][ref-table-chart].
### Subtotals
When the table is [pivoted](#pivoting) by two or more dimensions,
**Subtotals** appends a bold **Total for ‹value›** column after each pivot
group's columns, at every nesting level — for example, pivoting by year and
then status adds a **Total for 2024** column after 2024's status columns.
With fewer than two pivot dimensions the menu item is disabled, and if the
query changes so the pivot no longer qualifies, subtotals switch off
automatically.
On the left side, you can select a semantic view you would like to query. Inside the semantic view, you can see the measures and dimensions grouped either by cubes or folders. You can search within your semantic view to find the relevant member.
## Running queries
As you build a query — adding members, changing filters, adjusting sorting —
the workbook runs it automatically and refreshes the results. You can turn
this off with the auto-run toggle in the query controls: with auto-run
disabled, the results are marked as outdated while you edit the query, and
the query only runs when you click **Run query**. The toggle applies to the
current tab only.
A data model author can change the default for a semantic view with the
[`meta.auto_run`][ref-auto-run] parameter — selecting a view with
`auto_run: false` starts the tab with auto-run disabled. This is useful for
views that are expensive to query. You can still toggle auto-run back on at
any time.
An admin can also turn auto-run off by default for every tab in the
deployment, from **Model Configuration**. Per-view and per-tab settings still
take precedence over this deployment-wide default. See
[Auto-run][ref-configuration-auto-run] in the Model Configuration reference.
When a cell's value is too long for its column, it is truncated with an
ellipsis. Hover over a truncated cell to see its full value in a tooltip.
## Filtering
Dimensions and measures can be added as filters to focus on specific rows of data.
### Default filters
A data model author can define default workbook filters on a semantic view with
the [`meta.default_ui_filters`][ref-default-ui-filters] parameter:
```yaml theme={null}
views:
- name: orders_view
cubes:
- join_path: orders
includes: "*"
meta:
default_ui_filters:
- member: created_at
operator: between
values: ["7 days ago", "today"]
- member: status
operator: is
values: ["completed"]
```
When you select such a view in a new tab, those filters are added to the query
automatically. They behave exactly like filters you add yourself: you can
change their values, switch operators, or remove them.
Date range filters can use relative bounds like `7 days ago` or `this month`.
A relative range resolves each time the query runs, so the window rolls
forward day over day, and the filter's date editor opens on the **Relative**
tab showing its bounds. See
[`default_ui_filters`][ref-default-ui-filters] for the full list of accepted
operators and values.
Resetting the tab or going back to the view list clears default filters
along with the rest of the query; they are seeded again the next time you
select a view.
## Pivoting
You can add dimensions to the pivot by right-clicking on the left pane or in the results header.
Note that chart tables are different from results tables. You can configure pivots in chart tables separately.
## Totals
The totals menu (the **Σ** button) in the results toolbar adds summary rows
and columns to the results table: **Column Totals** (a pinned row at the
bottom with a total for each measure column), **Row Totals** (a total for
each row across the pivoted columns), and **Subtotals** (see below). All
three can be enabled at once; each setting is saved with the report and
carries over when you switch the chart type to [Table][ref-table-chart].
### Subtotals
When the table is [pivoted](#pivoting) by two or more dimensions,
**Subtotals** appends a bold **Total for ‹value›** column after each pivot
group's columns, at every nesting level — for example, pivoting by year and
then status adds a **Total for 2024** column after 2024's status columns.
With fewer than two pivot dimensions the menu item is disabled, and if the
query changes so the pivot no longer qualifies, subtotals switch off
automatically.
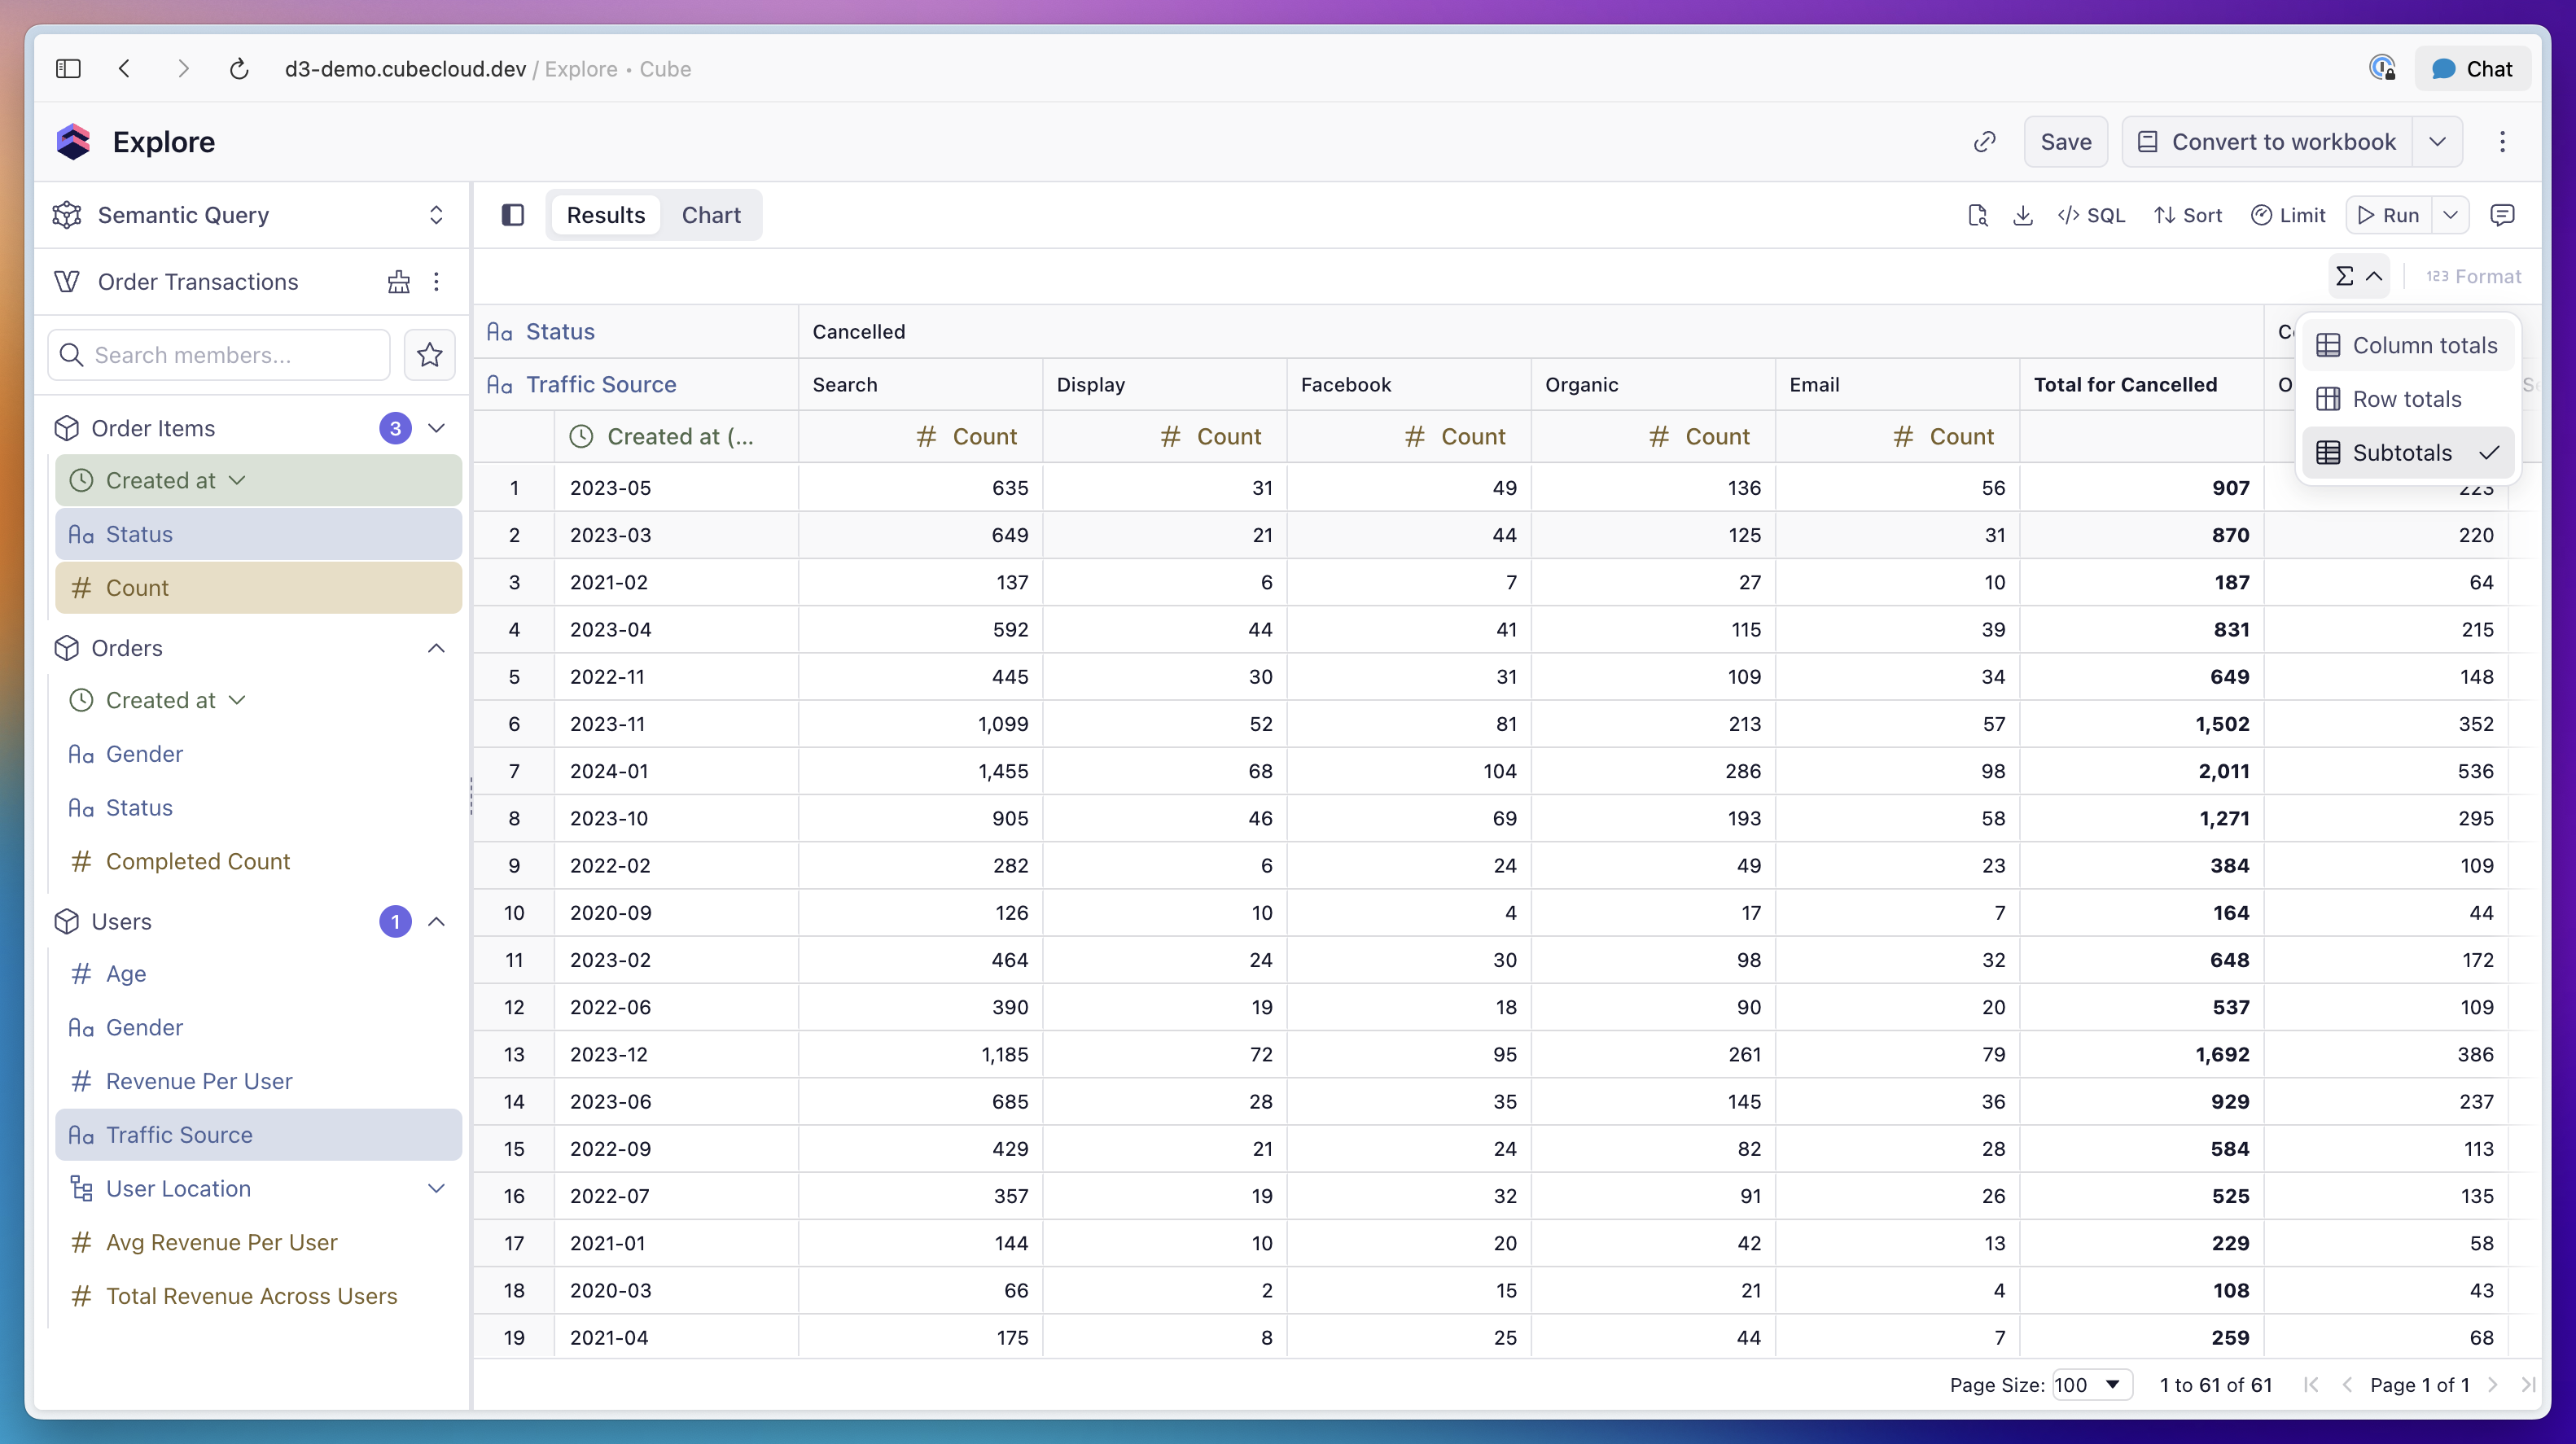 Subtotal values are computed by the database — one extra query per pivot
level — rather than by summing the visible cells, so they are correct for
non-additive measures such as counts of distinct values and averages, and
when the [row limit](#limiting) truncates the table. With **Column Totals**
also enabled, the pinned totals row shows a grand total for each pivot group.
* The toggle adds subtotals for all pivot levels at once; there is no
per-group control.
* Subtotals are not available for flat (non-pivoted) tables or in the
values-as-rows table layout.
* [Calculations][ref-calculated-fields] based on window functions, such as
**Running total**, are excluded — same as for row and column totals.
## Limiting
Every query in a workbook returns at most a fixed number of rows. By
default, queries are limited to **5,000 rows**, and you can adjust the
limit up to **50,000 rows** from the query controls.
The default and maximum values available in the workbook are governed by
the deployment's [Model Configuration][ref-configuration]:
* **Default row limit** is applied when a query doesn't specify one
explicitly.
* **Maximum row limit** is the upper bound — any value you pick in the
workbook is capped at this number.
Updating those settings at the deployment level changes what every
workbook in the deployment can request.
Large result sets can slow down chart rendering and may hit browser
memory limits, especially for tables. When possible, aggregate in the
semantic layer instead of pulling raw rows into the workbook.
## Sorting
You can sort query results using drop-down menus on column headers in the results table or the
dedicated sorting control.
### Column headers
Hover over a column header in the results table and expand the context menu to sort ascending, sort descending, or clear sorting.
If a column has sorting applied, a chevron icon on the header indicates the current sorting direction.
### Sorting control
The sorting control, available via the **Sort** button, lists all query members and their current state:
unsorted, sorted ascending, or sorted descending. Use it to apply or
change the sort order for any member. Drag and drop members within the sorting control to change their priority in the sort order.
Subtotal values are computed by the database — one extra query per pivot
level — rather than by summing the visible cells, so they are correct for
non-additive measures such as counts of distinct values and averages, and
when the [row limit](#limiting) truncates the table. With **Column Totals**
also enabled, the pinned totals row shows a grand total for each pivot group.
* The toggle adds subtotals for all pivot levels at once; there is no
per-group control.
* Subtotals are not available for flat (non-pivoted) tables or in the
values-as-rows table layout.
* [Calculations][ref-calculated-fields] based on window functions, such as
**Running total**, are excluded — same as for row and column totals.
## Limiting
Every query in a workbook returns at most a fixed number of rows. By
default, queries are limited to **5,000 rows**, and you can adjust the
limit up to **50,000 rows** from the query controls.
The default and maximum values available in the workbook are governed by
the deployment's [Model Configuration][ref-configuration]:
* **Default row limit** is applied when a query doesn't specify one
explicitly.
* **Maximum row limit** is the upper bound — any value you pick in the
workbook is capped at this number.
Updating those settings at the deployment level changes what every
workbook in the deployment can request.
Large result sets can slow down chart rendering and may hit browser
memory limits, especially for tables. When possible, aggregate in the
semantic layer instead of pulling raw rows into the workbook.
## Sorting
You can sort query results using drop-down menus on column headers in the results table or the
dedicated sorting control.
### Column headers
Hover over a column header in the results table and expand the context menu to sort ascending, sort descending, or clear sorting.
If a column has sorting applied, a chevron icon on the header indicates the current sorting direction.
### Sorting control
The sorting control, available via the **Sort** button, lists all query members and their current state:
unsorted, sorted ascending, or sorted descending. Use it to apply or
change the sort order for any member. Drag and drop members within the sorting control to change their priority in the sort order.
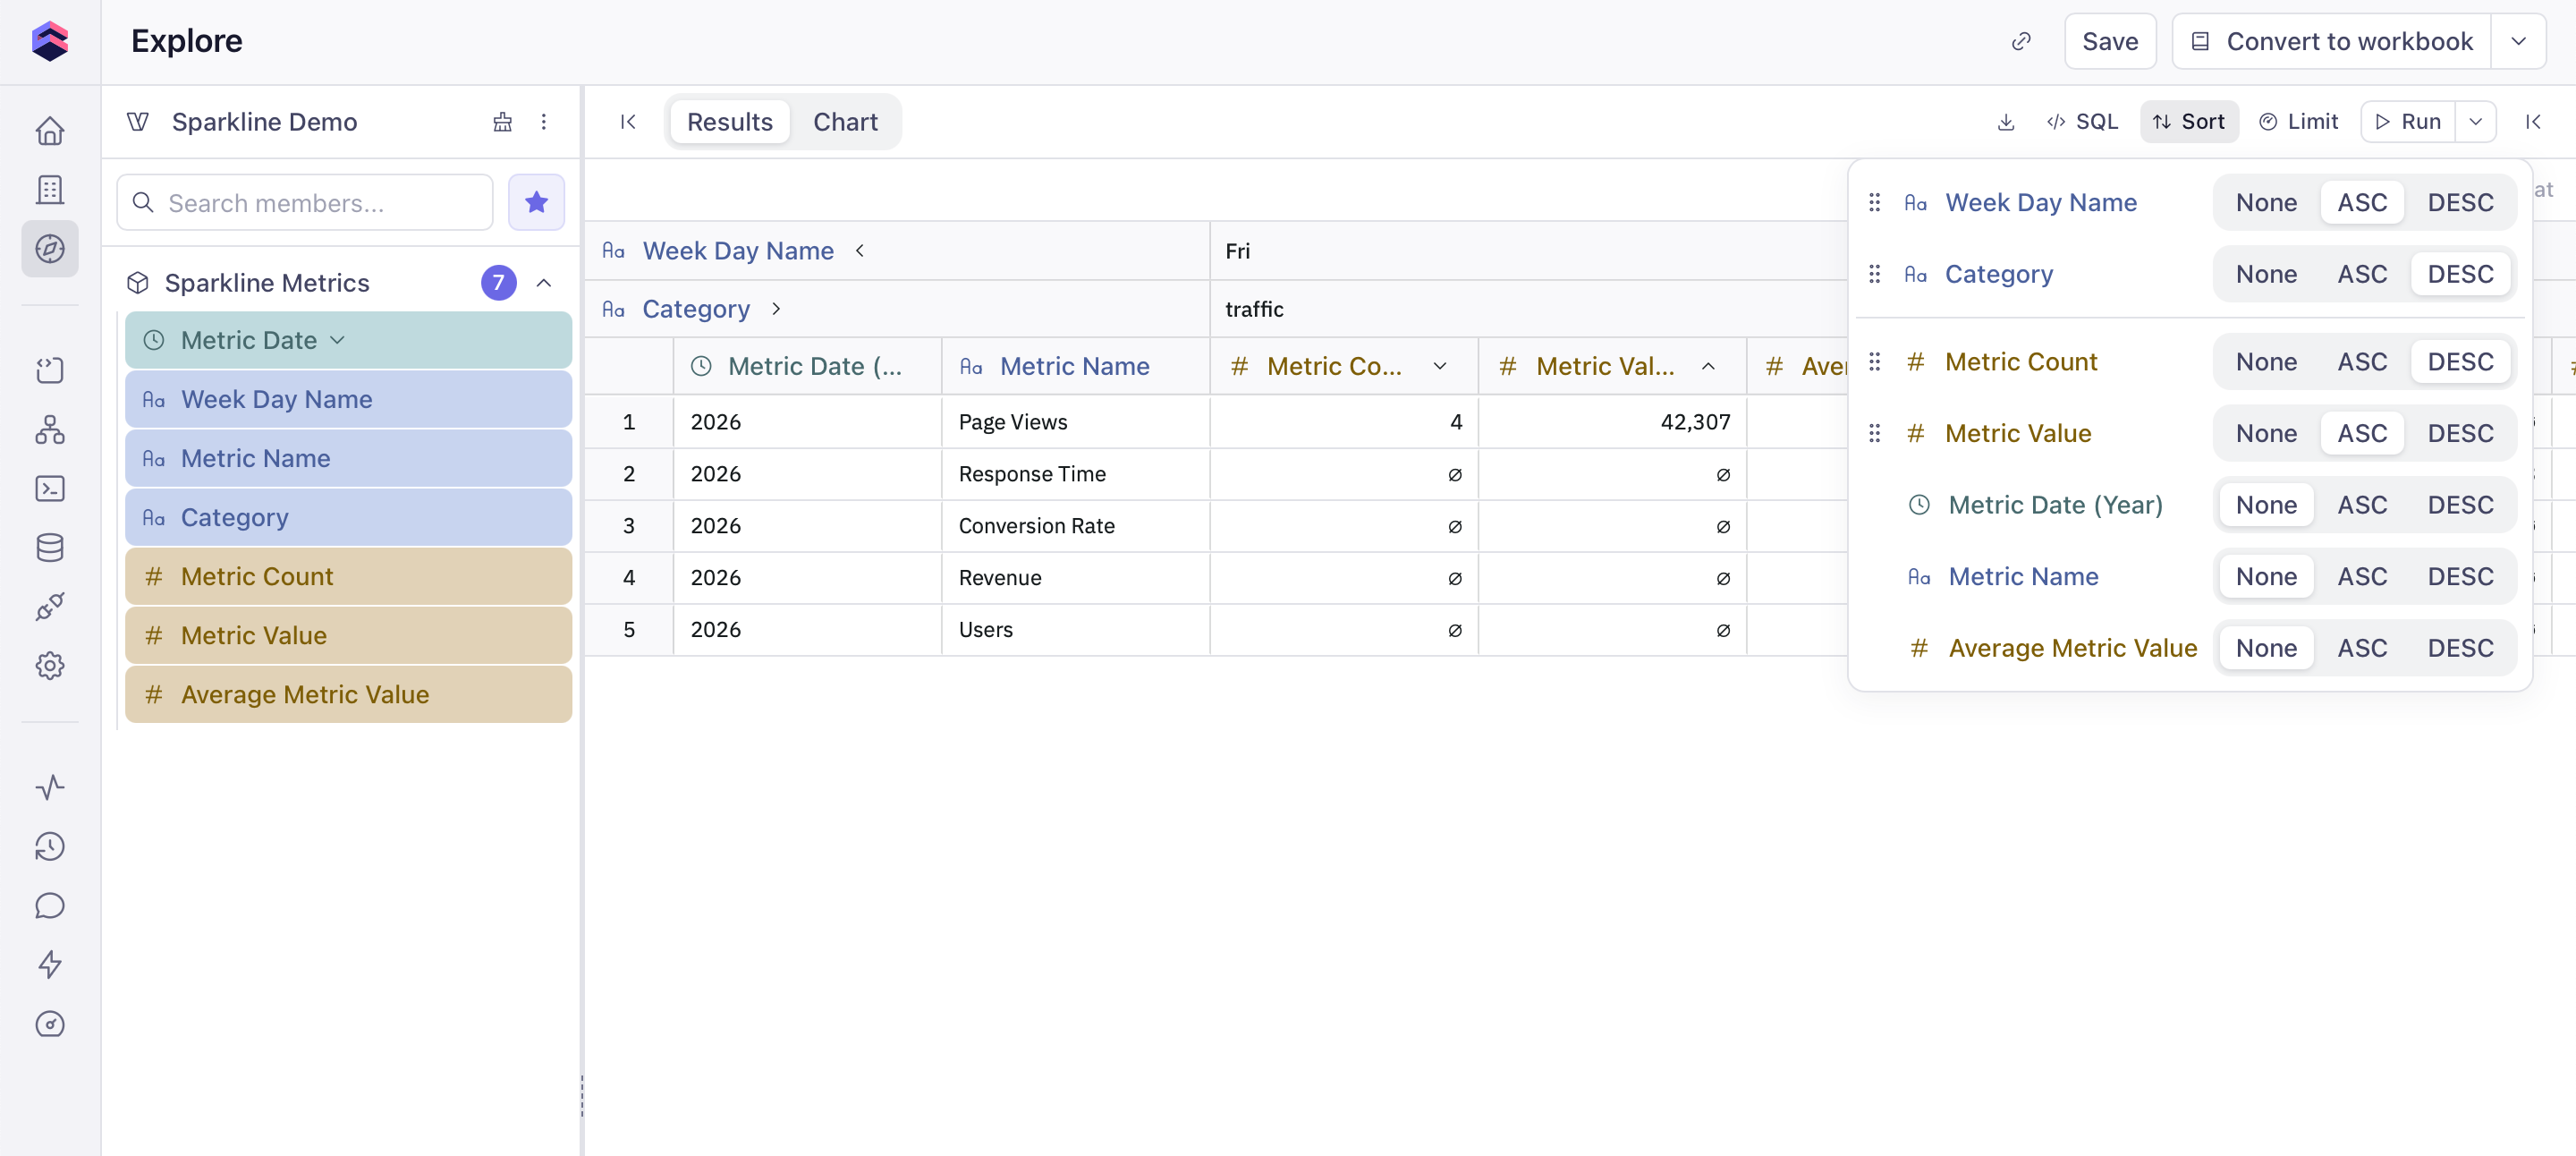 When a [pivot](#pivoting) is applied, an additional section with pivot dimensions appears.
## Filling in missing rows
A time-series query only returns rows for date buckets that actually contain
data. If no orders were created in a given month, that month is simply absent
from the result — which reads as a misleading gap in tables and charts. Fill
in missing rows densifies the result so every date bucket in the range is
present.
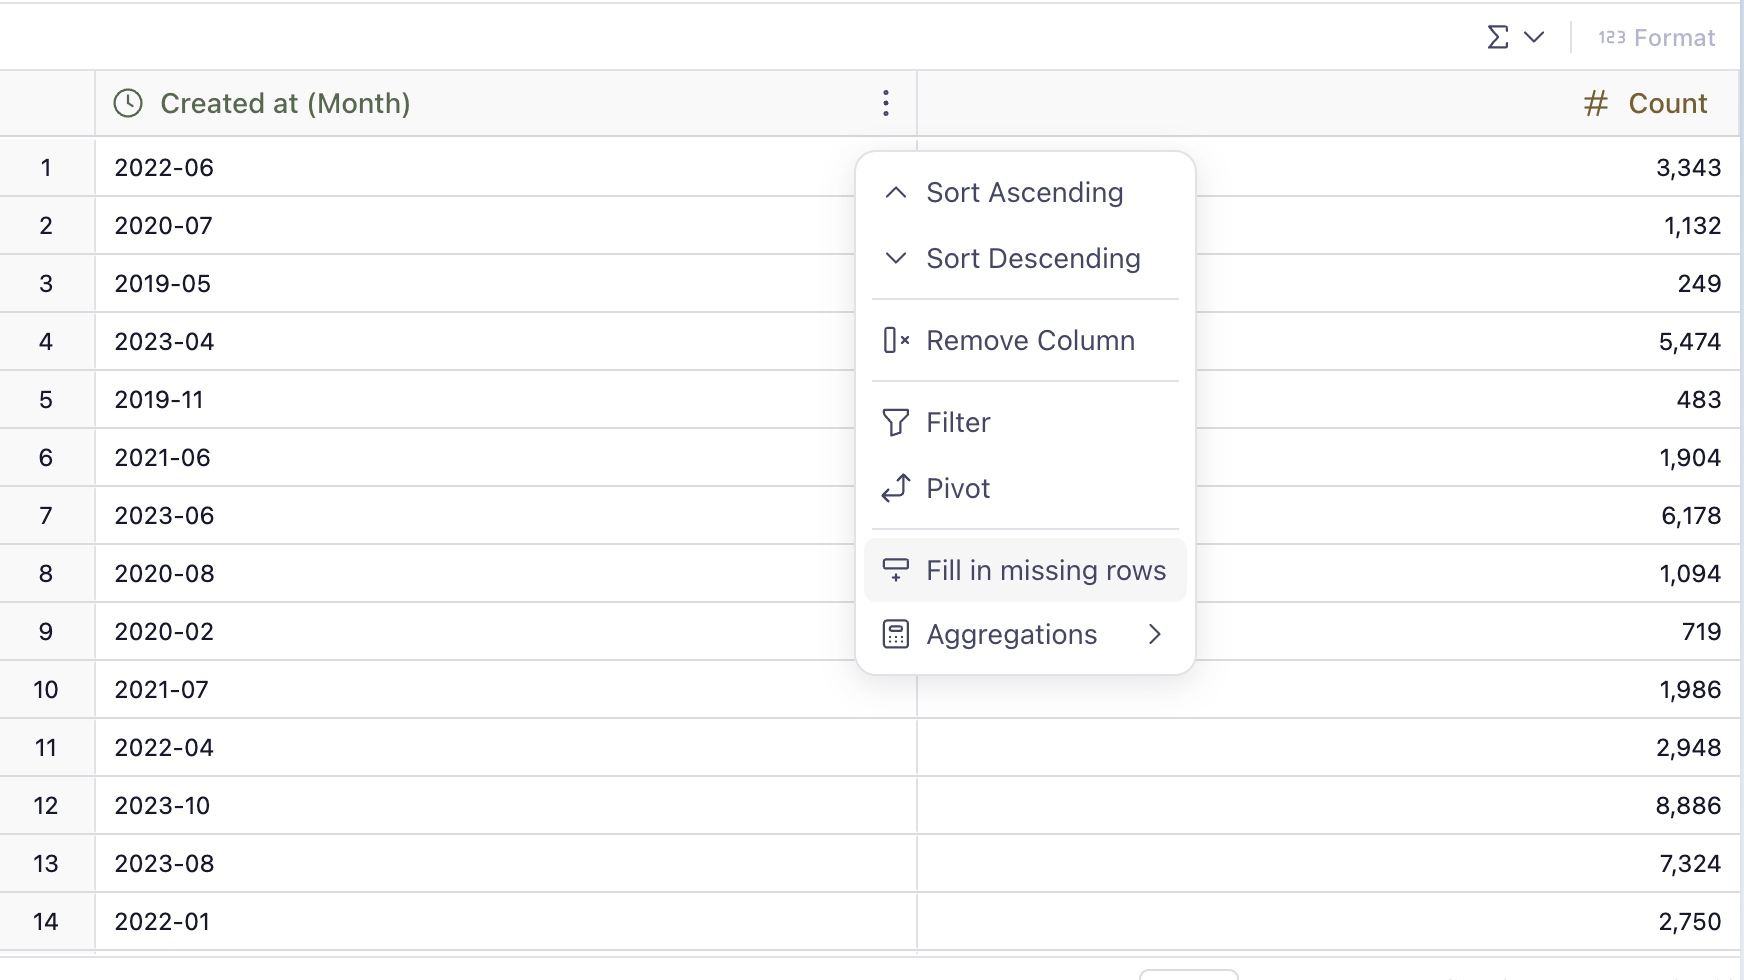
To apply it, hover over the header of a time dimension column in the results
table, expand the context menu, and select **Fill in missing rows**. To turn
it off, select **Stop filling missing rows** from the same menu. While the
fill is active, an icon on the column header indicates it.
When a [pivot](#pivoting) is applied, an additional section with pivot dimensions appears.
## Filling in missing rows
A time-series query only returns rows for date buckets that actually contain
data. If no orders were created in a given month, that month is simply absent
from the result — which reads as a misleading gap in tables and charts. Fill
in missing rows densifies the result so every date bucket in the range is
present.
To apply it, hover over the header of a time dimension column in the results
table, expand the context menu, and select **Fill in missing rows**. To turn
it off, select **Stop filling missing rows** from the same menu. While the
fill is active, an icon on the column header indicates it.
 The fill works on time dimensions with a year, quarter, month, week, or day
granularity. The date range comes from the date filters on that dimension, or
from the earliest and latest dates in the data. In added rows, additive
measures such as counts and sums are set to `0`; other measures are left
empty.
The fill doesn't change the query or the generated SQL — the missing rows are
added when the report is rendered. It is saved with the report and applies
everywhere it appears, including [dashboards][ref-dashboards].
The fill is skipped when it would produce more than 10,000 rows. When that
happens, the column header indicator warns you.
## Inspecting queries
Every query in the Semantic Query tab can be inspected as code. Open the SQL panel via the **SQL** button in the top-right toolbar to see the query that the workbook generates, switch between representations, and copy it for use elsewhere.
The fill works on time dimensions with a year, quarter, month, week, or day
granularity. The date range comes from the date filters on that dimension, or
from the earliest and latest dates in the data. In added rows, additive
measures such as counts and sums are set to `0`; other measures are left
empty.
The fill doesn't change the query or the generated SQL — the missing rows are
added when the report is rendered. It is saved with the report and applies
everywhere it appears, including [dashboards][ref-dashboards].
The fill is skipped when it would produce more than 10,000 rows. When that
happens, the column header indicator warns you.
## Inspecting queries
Every query in the Semantic Query tab can be inspected as code. Open the SQL panel via the **SQL** button in the top-right toolbar to see the query that the workbook generates, switch between representations, and copy it for use elsewhere.
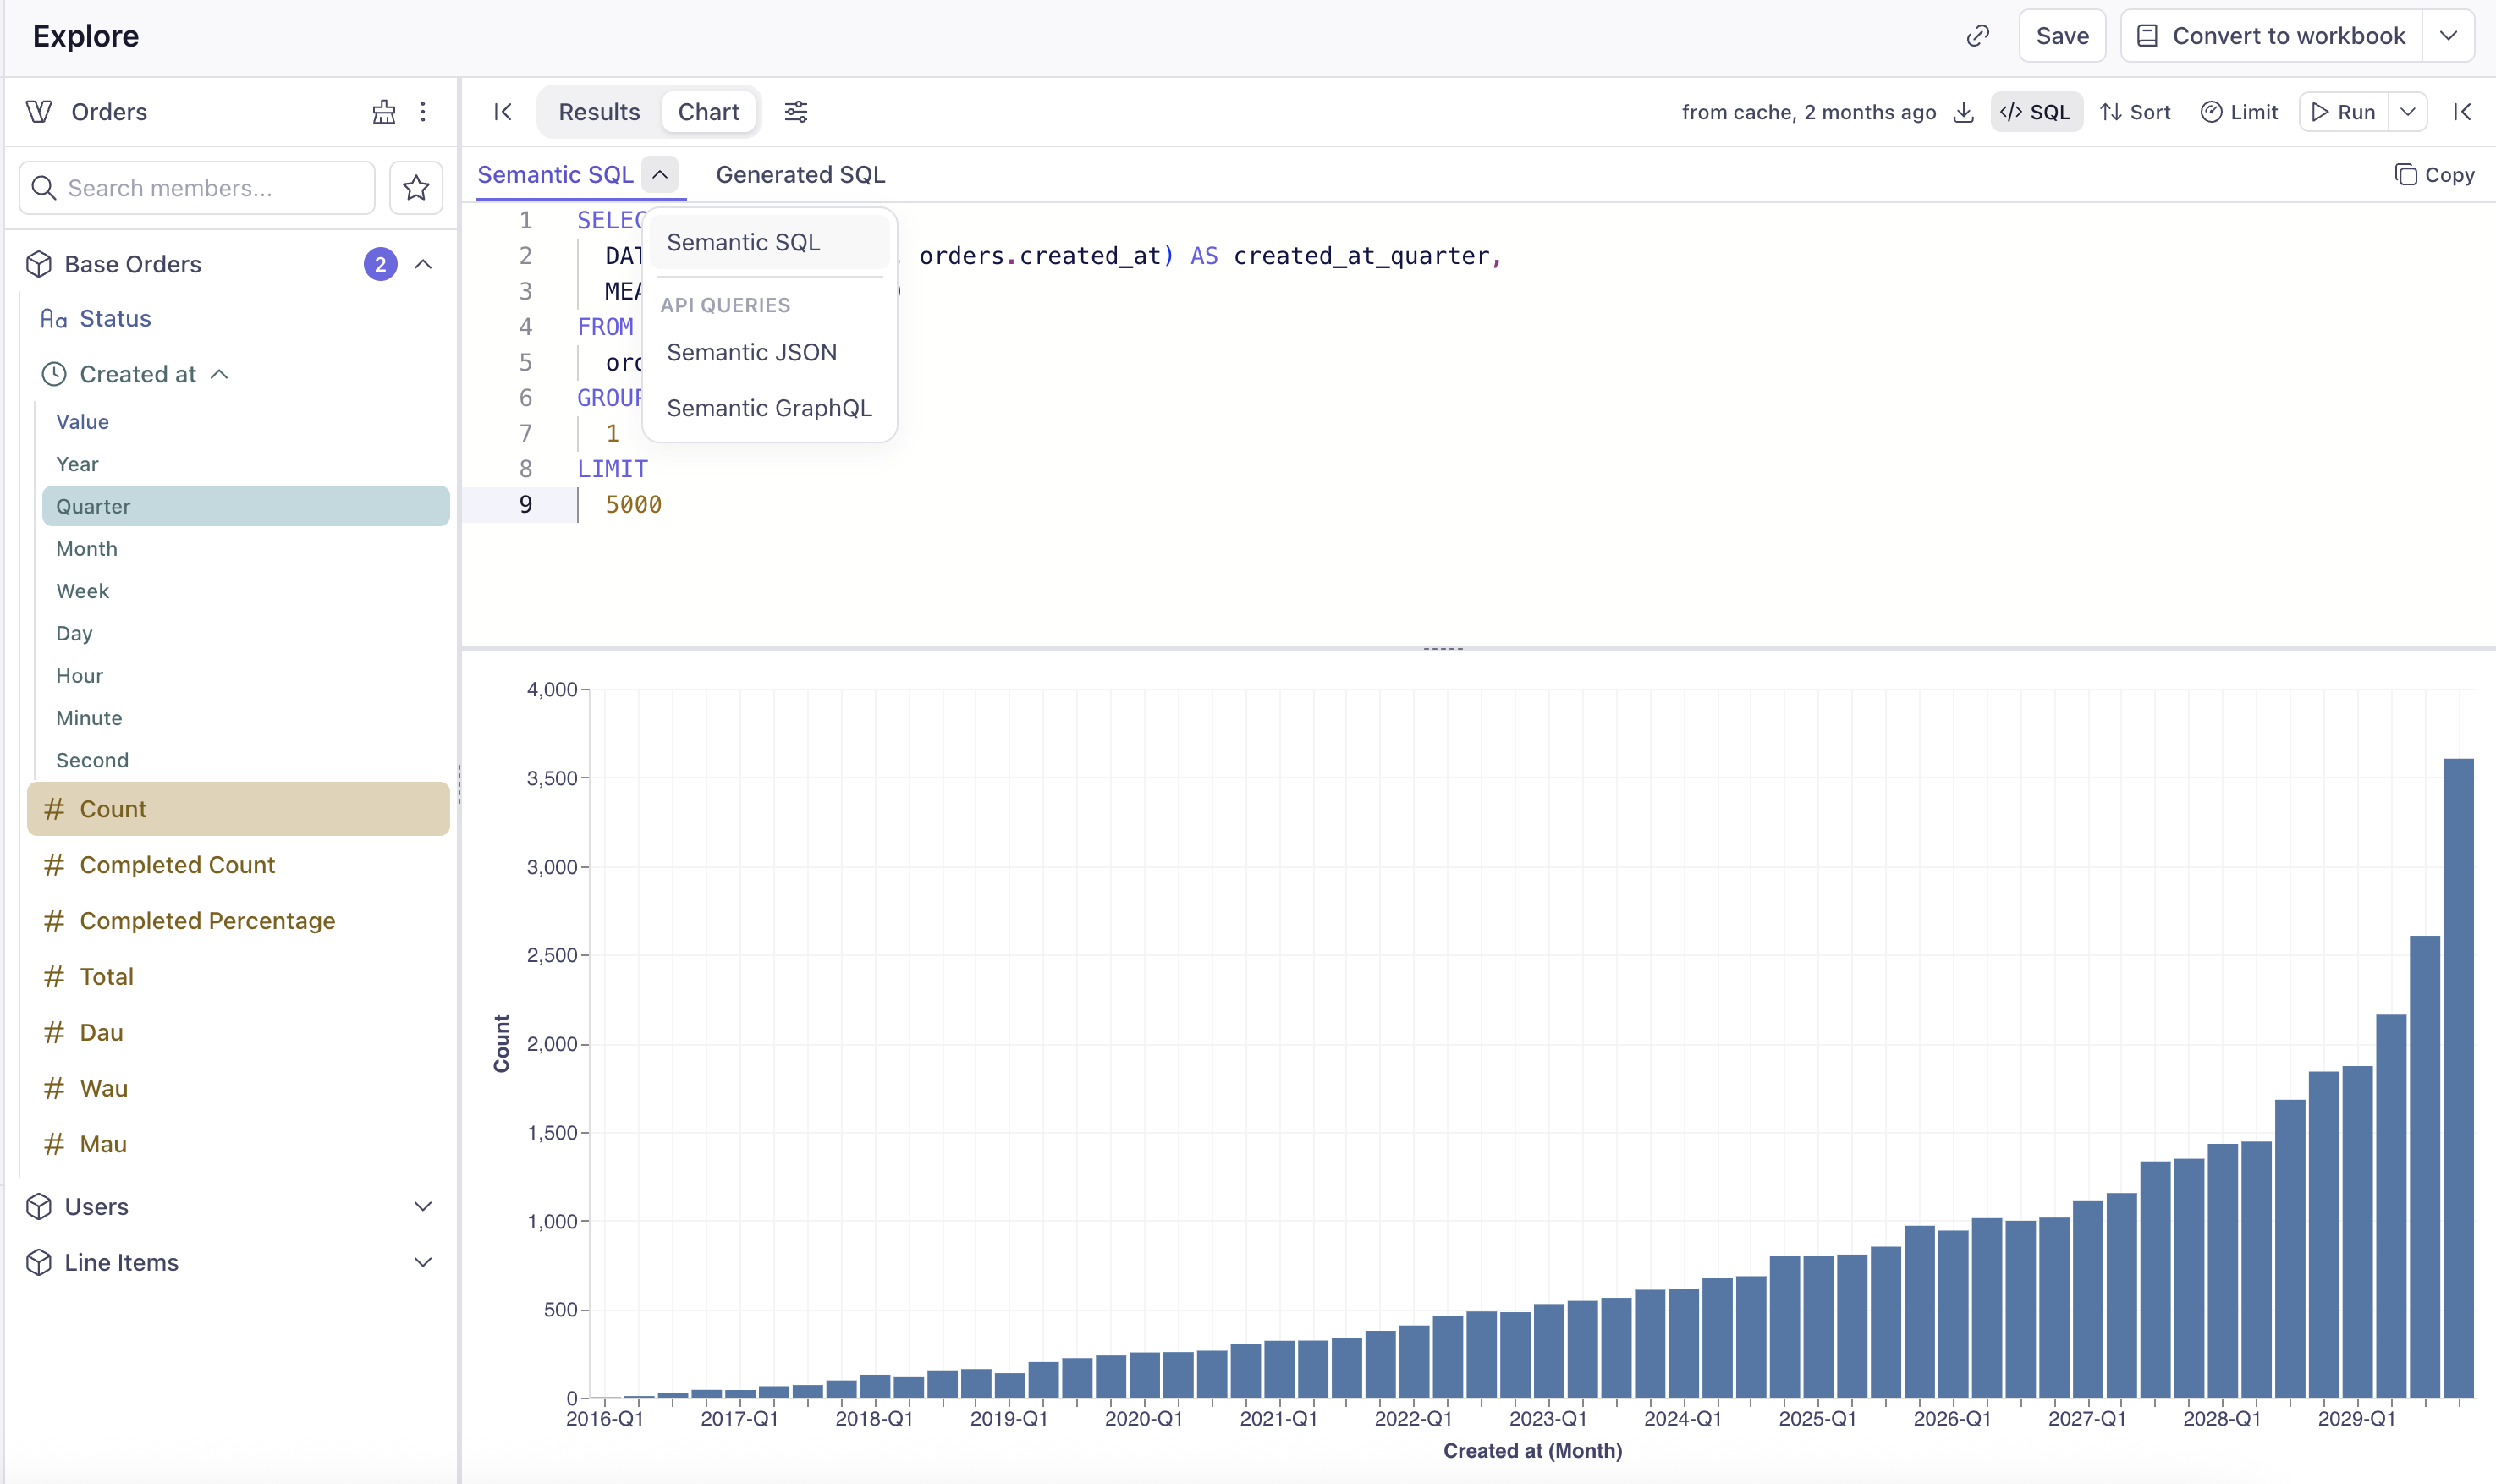 The panel exposes two top-level tabs:
* **Semantic SQL** — the query expressed against the Semantic Model (semantic views, measures, dimensions, and `MEASURE()` calls). This is the source of truth for the query and what the workbook stores.
* **Generated SQL** — the SQL that Cube compiles from the Semantic SQL and sends to your data warehouse. Use it to understand exactly what runs against your database, debug performance, or share with a database administrator.
The **Semantic SQL** tab also has a dropdown for viewing the same query in the formats accepted by Cube's [Core Data APIs][ref-core-data-apis]:
* **Semantic JSON** — the [REST (JSON) API][ref-rest-api] query format
* **Semantic GraphQL** — the [GraphQL API][ref-graphql-api] query format
These views are convenient when you want to take a query you've built interactively in a workbook and reuse it directly through one of the Core Data APIs from your own application.
## Result freshness and provenance
Two indicators next to each result describe the data behind it.
* **Freshness** — a leaf icon shows how recently the underlying data was refreshed. Hover over it to see the last refresh time (for example, "Refreshed 5 minutes ago"); its color shifts as the data ages, so you can tell fresh from stale results at a glance. If the refresh time can't be determined, the leaf turns gray with a "Data age unknown" label. When you have access to [Query History](/admin/monitoring/query-history), clicking the leaf opens the underlying request for that result.
* **Pre-aggregation** — for those same users, a lightning-bolt icon appears next to the leaf with a "Served from a pre-aggregation" label whenever the result was served from a [pre-aggregation](/docs/pre-aggregations). If no icon is shown, the query ran directly against your data source.
## Editing Semantic SQL by hand
You can edit the Semantic SQL directly in the editor to refine a query — for example, to add a `WHERE` clause, change `GROUP BY` order, or apply a different sort. After making changes, click **Save and Run** to apply them to the query and refresh the results, or **Discard** to revert.
The panel exposes two top-level tabs:
* **Semantic SQL** — the query expressed against the Semantic Model (semantic views, measures, dimensions, and `MEASURE()` calls). This is the source of truth for the query and what the workbook stores.
* **Generated SQL** — the SQL that Cube compiles from the Semantic SQL and sends to your data warehouse. Use it to understand exactly what runs against your database, debug performance, or share with a database administrator.
The **Semantic SQL** tab also has a dropdown for viewing the same query in the formats accepted by Cube's [Core Data APIs][ref-core-data-apis]:
* **Semantic JSON** — the [REST (JSON) API][ref-rest-api] query format
* **Semantic GraphQL** — the [GraphQL API][ref-graphql-api] query format
These views are convenient when you want to take a query you've built interactively in a workbook and reuse it directly through one of the Core Data APIs from your own application.
## Result freshness and provenance
Two indicators next to each result describe the data behind it.
* **Freshness** — a leaf icon shows how recently the underlying data was refreshed. Hover over it to see the last refresh time (for example, "Refreshed 5 minutes ago"); its color shifts as the data ages, so you can tell fresh from stale results at a glance. If the refresh time can't be determined, the leaf turns gray with a "Data age unknown" label. When you have access to [Query History](/admin/monitoring/query-history), clicking the leaf opens the underlying request for that result.
* **Pre-aggregation** — for those same users, a lightning-bolt icon appears next to the leaf with a "Served from a pre-aggregation" label whenever the result was served from a [pre-aggregation](/docs/pre-aggregations). If no icon is shown, the query ran directly against your data source.
## Editing Semantic SQL by hand
You can edit the Semantic SQL directly in the editor to refine a query — for example, to add a `WHERE` clause, change `GROUP BY` order, or apply a different sort. After making changes, click **Save and Run** to apply them to the query and refresh the results, or **Discard** to revert.
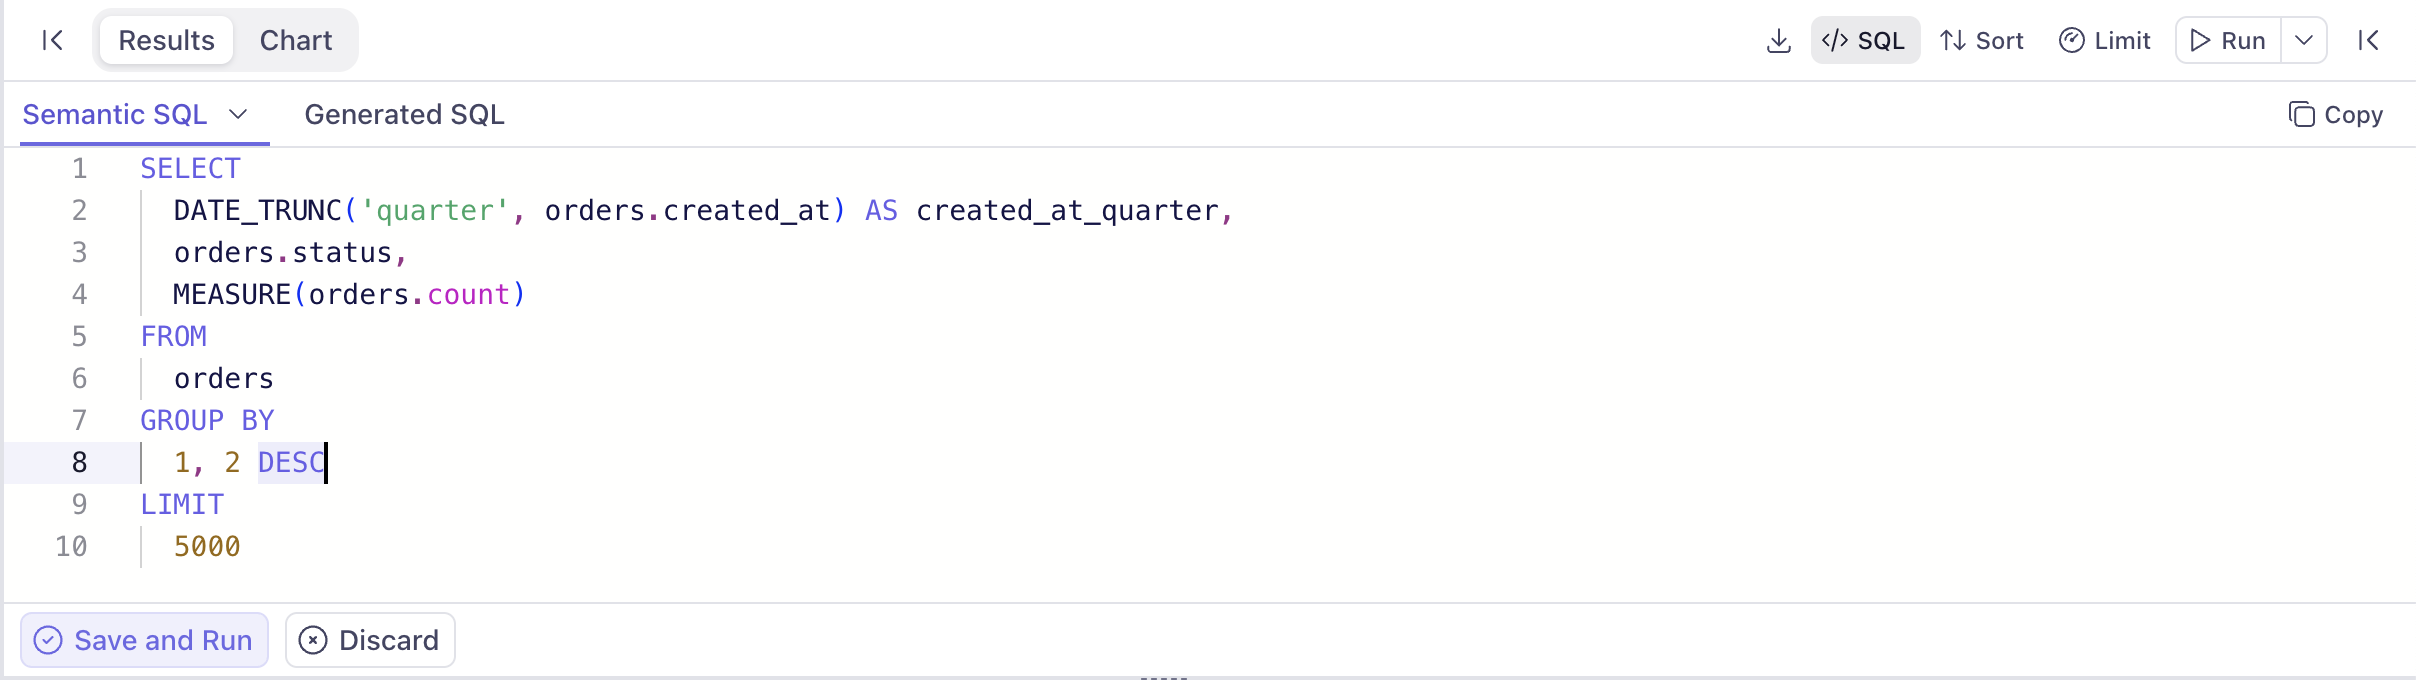 When you save a hand-edited query, the workbook keeps the Semantic SQL as the source of truth, and the visual controls (members panel, sort, pivot) stay in sync with what's expressible in the UI. Anything that goes beyond the interactive controls — see [Advanced semantic queries](#advanced-semantic-queries) below — disables the affected UI controls but keeps the rest of the workbook fully functional.
## Advanced semantic queries
Advanced semantic queries typically can contain CTEs (Common Table Expressions) and unions, and can contain multiple semantic views. In many cases for advanced semantic queries, the interactive components of the UI would be disabled—not the whole UI—as these complex queries require manual SQL editing.
When you save a hand-edited query, the workbook keeps the Semantic SQL as the source of truth, and the visual controls (members panel, sort, pivot) stay in sync with what's expressible in the UI. Anything that goes beyond the interactive controls — see [Advanced semantic queries](#advanced-semantic-queries) below — disables the affected UI controls but keeps the rest of the workbook fully functional.
## Advanced semantic queries
Advanced semantic queries typically can contain CTEs (Common Table Expressions) and unions, and can contain multiple semantic views. In many cases for advanced semantic queries, the interactive components of the UI would be disabled—not the whole UI—as these complex queries require manual SQL editing.
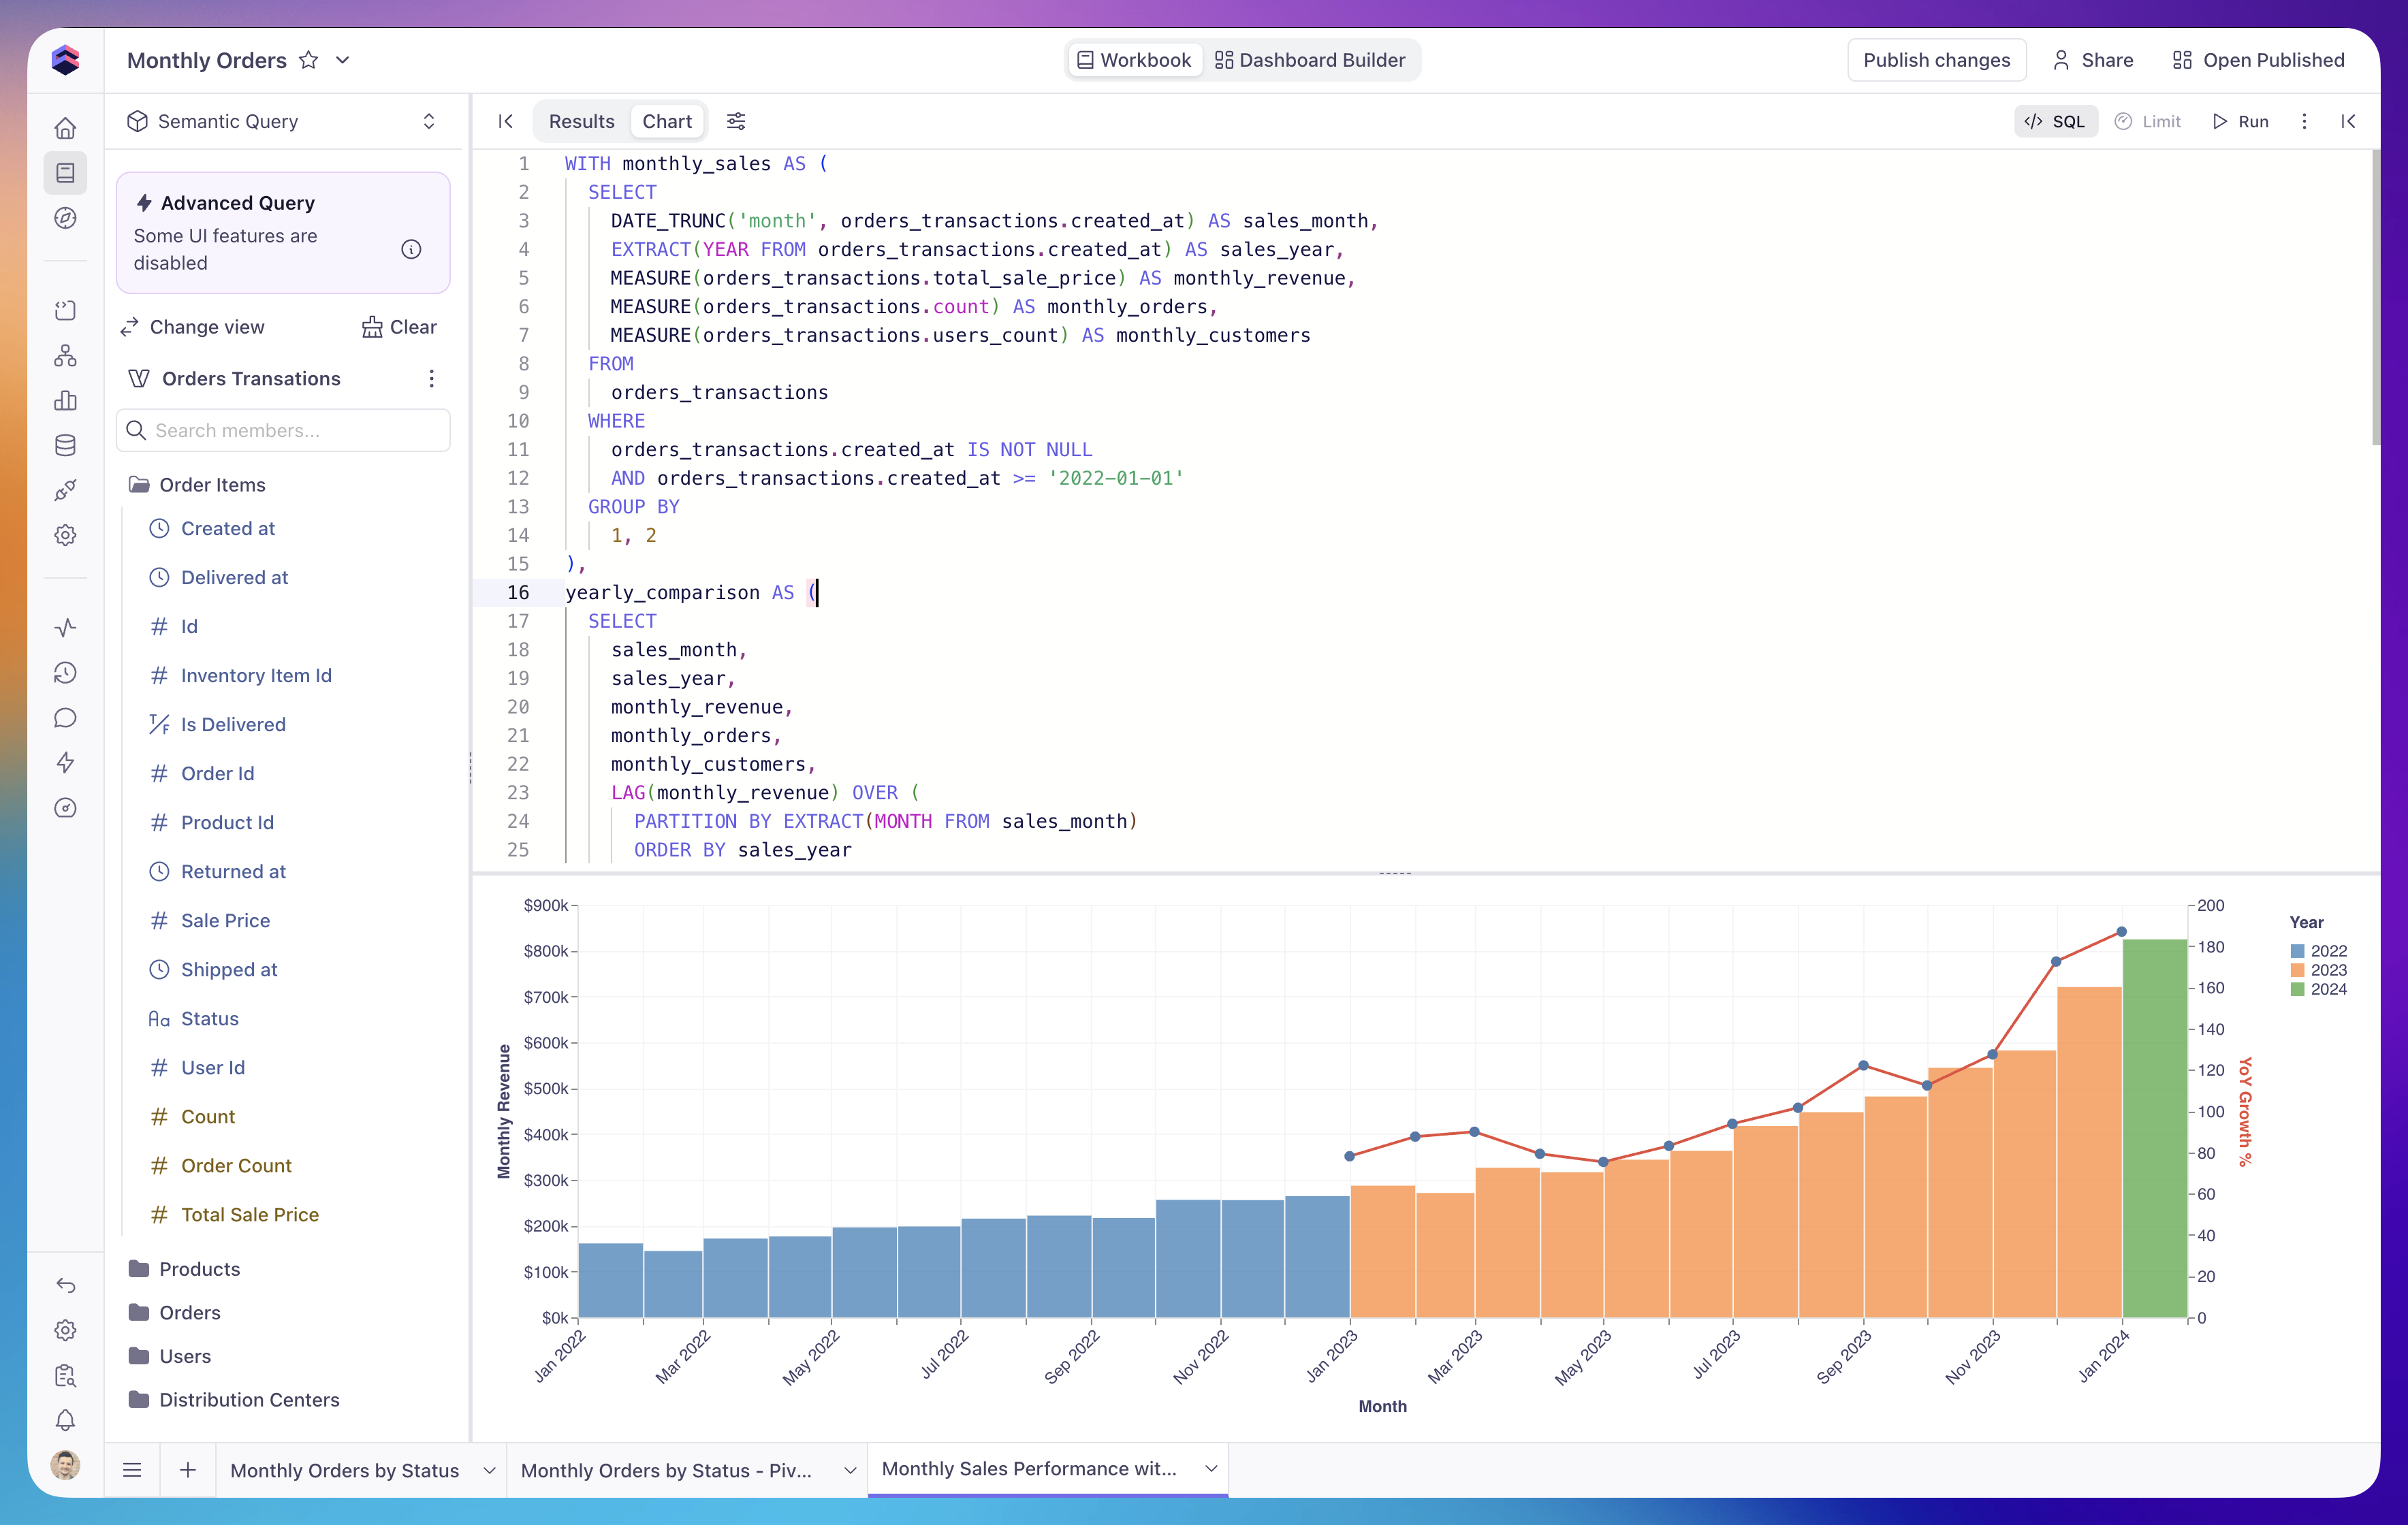 Currently, advanced semantic queries can be placed on dashboards, but dashboard filters cannot be applied to advanced semantic queries.
## Applying a security context
When you run a query—in a workbook, on a dashboard, or in [Explore][ref-explore]—Cube
generates a token to execute it against the semantic layer. If you have developer or
admin access, you can attach a [security context][ref-security-context] to that token
directly from the page you're working on. The values you provide are used when the
token is generated, overriding the claims that would otherwise come from your session.
The security context you set is also respected by [AI agents][ref-analytics-chat]:
any query an agent runs on your behalf—whether in the workbook or in the IDE—executes
under the same context. This lets you confirm an agent sees exactly the data a given
end user would.
### What you can override
* **Groups** — choose **Inherit** to keep the Cube Cloud groups resolved from your
session, **Custom** to query as a specific set of groups, or **None** to query with
no groups at all.
* **User attributes** — keep the attributes resolved from your session, or override
them with your own values.
Setting a security context requires developer or admin access (deployment edit
access). Overriding the Cube Cloud **groups** and **user attributes** specifically
requires the admin role. Users without edit access always query with the security
context derived from their own session.
You can't use a security context to impersonate another user. The `email` claim is
never overridable—it's always taken from your own session—so you can't run queries on
behalf of someone else.
This is primarily a testing tool. It lets you reproduce what a specific end user would
see and verify [access control][ref-access-control] and multitenancy behavior without
leaving Cube Cloud. It's especially useful when a query fails or returns no data
because the data model expects security context values that aren't present in your
session—you can supply them here and confirm the model (and any agent that queries it)
behaves as intended.
[ref-core-data-apis]: /reference/core-data-apis
[ref-rest-api]: /reference/core-data-apis/rest-api
[ref-graphql-api]: /reference/core-data-apis/graphql-api
[ref-configuration]: /docs/data-modeling/configuration
[ref-security-context]: /docs/data-modeling/access-control/context
[ref-access-control]: /docs/data-modeling/access-control
[ref-dashboards]: /docs/explore-analyze/dashboards
[ref-explore]: /docs/explore-analyze/explore
[ref-analytics-chat]: /docs/explore-analyze/analytics-chat
[ref-default-ui-filters]: /reference/data-modeling/view#default_ui_filters
[ref-table-chart]: /docs/explore-analyze/charts/chart-types/table
[ref-calculated-fields]: /docs/explore-analyze/workbooks/calculated-fields
[ref-auto-run]: /reference/data-modeling/view#auto_run
[ref-configuration-auto-run]: /docs/data-modeling/configuration#auto-run
Currently, advanced semantic queries can be placed on dashboards, but dashboard filters cannot be applied to advanced semantic queries.
## Applying a security context
When you run a query—in a workbook, on a dashboard, or in [Explore][ref-explore]—Cube
generates a token to execute it against the semantic layer. If you have developer or
admin access, you can attach a [security context][ref-security-context] to that token
directly from the page you're working on. The values you provide are used when the
token is generated, overriding the claims that would otherwise come from your session.
The security context you set is also respected by [AI agents][ref-analytics-chat]:
any query an agent runs on your behalf—whether in the workbook or in the IDE—executes
under the same context. This lets you confirm an agent sees exactly the data a given
end user would.
### What you can override
* **Groups** — choose **Inherit** to keep the Cube Cloud groups resolved from your
session, **Custom** to query as a specific set of groups, or **None** to query with
no groups at all.
* **User attributes** — keep the attributes resolved from your session, or override
them with your own values.
Setting a security context requires developer or admin access (deployment edit
access). Overriding the Cube Cloud **groups** and **user attributes** specifically
requires the admin role. Users without edit access always query with the security
context derived from their own session.
You can't use a security context to impersonate another user. The `email` claim is
never overridable—it's always taken from your own session—so you can't run queries on
behalf of someone else.
This is primarily a testing tool. It lets you reproduce what a specific end user would
see and verify [access control][ref-access-control] and multitenancy behavior without
leaving Cube Cloud. It's especially useful when a query fails or returns no data
because the data model expects security context values that aren't present in your
session—you can supply them here and confirm the model (and any agent that queries it)
behaves as intended.
[ref-core-data-apis]: /reference/core-data-apis
[ref-rest-api]: /reference/core-data-apis/rest-api
[ref-graphql-api]: /reference/core-data-apis/graphql-api
[ref-configuration]: /docs/data-modeling/configuration
[ref-security-context]: /docs/data-modeling/access-control/context
[ref-access-control]: /docs/data-modeling/access-control
[ref-dashboards]: /docs/explore-analyze/dashboards
[ref-explore]: /docs/explore-analyze/explore
[ref-analytics-chat]: /docs/explore-analyze/analytics-chat
[ref-default-ui-filters]: /reference/data-modeling/view#default_ui_filters
[ref-table-chart]: /docs/explore-analyze/charts/chart-types/table
[ref-calculated-fields]: /docs/explore-analyze/workbooks/calculated-fields
[ref-auto-run]: /reference/data-modeling/view#auto_run
[ref-configuration-auto-run]: /docs/data-modeling/configuration#auto-run